1)WebI has a desktop version now.
Now you will be able to save your webI reports on desktop as a client tool has been introduced for the creation of WebI Reports. No more issues of global license. You just need a WebI license to create a WebI Report
2)The major improvement of XI 3.0 over XI R2 is architecture/administration-related:
- The user-interface of the Central Management Console (CMC) has improved: it mimics the Windows Explorer interface with its directory trees and pull-down menus;
- The new 'Security Query' in CMC enables administrators to search for specific objects;
- Auditing services comes now standard with CMC - No additional licence-costs are required anymore;
- Report-scheduling comes now standard with CMC. Also schedule options for WebIntelligence, Business Objects & Crystal Reports have improved so it matches BO6's BroadCastAgent Publisher;
- The new 'Federation'-option enables you to replicate servers on different locations;
- The 'Server Intelligence Agent' (SIA), a program that starts monitors and stops servers, is added. It makes the Enterprise-system not dependent anymore on a single CMS;
- It is now possible to create and add your own default security-level next to the existing 'View on Demand', 'Full Control', et cetera;
- The Import Wizard, used for importing objects from different environments and earlier BO versions, is extended and now also allows to import documents on their name only instead of the internal CUID-key.
There is still room for lots of improvements: version-control of objects is still non-existent, event-based scheduling is not well-supported, user-administration cannot be done batchwise and the general user-interface of CMC, despite having been improved, is still a major drawback compared to BO 6 in terms of userfriendliness and understandability.
3)There are optional prompts , i think thsi feature added will remove 'All ' in list of values other new feature is we can see what all data is changed from previous run of report
4)Here are few more differences from design point of view.
The new feature in Webi is the smart measure:
It is a measure that delegates its aggregation calculation to a database. Smart measure performs calculation that the standard Webi aggregation mechanism cannot calculate correctly.
E.g: Complex averages,such as average of a percentage,ratios,etc.. Smart measures are available for all relational and OLAP data sources.
It provides some new Querying functions:
-Delegated LOV search-It delegates the search of values in an LOV to the database.
Features:
1. Prevents LOV from being loaded automatically.
2. Prevents the report user from refreshing the LOV
3. Restricts the data set returned.
4. Limits the load time to one that the report user finds acceptable
-Optional Prompt-applies only to report level prompts not universe prompts.
-Percent rank
It allows the report user to rank a percentage of dimension volume "sliced" on another dimension. This feature is available only on Java report panel.
-Sampling
The query sampling returns specified number of items and selects them randomly.
-Forcemerge
-Data Tracking:
This feature allows a report user to highlight the values that have changed since previous refresh for any level of aggregation.
5)The Designer part of XI3 is enhanced so that we can create universes based on Stored procedures in database which can be easily accessed by business users for generation of webi reports through infoview. There is a huge difference between XIR2 and XI3 infoview in terms of infoview customization.
6)Multilingual support for metadata is now available with the introduction of "Translation Manager".This helps avoiding the rework in replicating the universe for different languages. But this is restricted to only WebIntelligence reports,where by the language setting can be choosen from Infoview settings for "preferred viewing Locale"
7)Few more new features of BO XI3
Support for Nested Derived Tables
Compulsory filters at universe and class level
Custom Drivers
Enhanced SAP BW support
8)There is a security configuration improvement that I consider very helpful. the option to apply security to one object but avoiding to spread it to the lower levels. So you do not have to broke inheritance from each object on the next (lower) level to have this working.
Thursday, December 11, 2008
Wednesday, September 17, 2008
Tuesday, September 16, 2008
ODS Vs. Data Warehouse
ODS Vs. Data Warehouse
Operational Data store
- Data Focused Integration From Transaction Processing Focused Systems
- Age Of The Data is Current, Near Term (Today, Last Week’s)
- Primary Use: Day-To-Day Decisions Tactical Reporting Current Operational
Results
- Frequency Of Load: Twice Daily , Daily, Weekly
Datawarehouse
- Subject Oriented,Integrated,Non-Volatile,Time Variant
- Age of the Data is Historic (Last Month, Qtrly, Five Years)
- Primary Use: Long-Term Decisions Strategic Reporting Trend Detection
- Frequency of load : Weekly, Monthly, Quarterly
Monday, July 28, 2008
Desktop Intelligence Vs WebIntelligence in XI R2
Desktop Intelligence Vs WebIntelligence in XI R2
General Look & Feel:
Entering Deski/Webi:
For Deski:
Wizard: Universe vs. Other Data Source
4 wizard options (cell, table, crosstab,chart)
Many Microsoft formatting toolbars
For Webi:
Universes (Or OLAP) Only
No personal data files (Excel, XML, etc)
No real wizard
Limited Microsoft formatting toolbars
Interactive Mode: Can Enter By accident
Query Panel:
For Deski:
Data Tab
When editing query, does add new objects to the report
Radial button for display of classes and object or predefined conditions
Button For: Save & Close/View/Run/Cancel
View Button for look at data and other functions
Add Query From Report Manager Window
Right Click in white area in Data Section
Insert New Data Wizard pops up
Report Manager: Click radial button to sort by data provider
Edit only 1 query at a time
User Objects can be created
View SQL
For Webi:
Data Tab
When editing existing query, does NOT add in to the report
Edit Query/Edit Report Icon
Properties tab for queries
Predefined conditions integrated together with classes and objects
Run Query Button on top (Only 1 option)
Can selectively run only 1 instead of all queries (Refresh too)
No View Button
No statistics/view data options
Can hide the Query Filter Box
Add Query Button (To open up another query panel)
Creates a Query Tab in Query Window
Has mini speed menu for those Tabs
Report Manager: Click down arrow to sort by query
Can click on query tab to edit directly (jump around)
No regular templates option
No User Objects capability
View SQL now available
Scope of Analysis Option (Click On/Off)
Appears on bottom of query panel (Below Query Filters Box)
Creating Query Filters (Conditions) more convenient: List of Operators and some Operand settings displayed within Query Filter-Builder.
No ‘Show List of prompts’ choice in Query Filters.
(Properties?) Tab next to Data Tab has box for changing retrieval record limit or retrieval time.
Report Manager:
For Deski:
Slice & Dice Panel
Format Templates
No drag and drop templates
Microsoft Formatting Toolbars
No Report Filter Window
Drilling: Must Grab All dimensions down path, or use scope of analysis
For Webi:
No Slice & Dice Panel
“Templates” Option (Drag and Drop)
No Format Templates
No Query on Query/Subquery Calc
No Grouping (Clip Icon)
No hide Objects
No Count All
No Fold option
Dragging/Dropping within Report Window very easy.
Can drag objects directly from Results Object window to Query Filters
No personal lov’s
Limited Microsoft Formatting Toolbars
Right Click on Edge of Report: Turn To Option
4 Report Options + 1 Full Chart Options as well
Report Filter Window Option (Appears on top of display)
To Remove Calcs: Drag Off or Structure Mode or Right Click/Remove Row or Column
Custom Sorts: But less sorting options
Breaks: Less Property Options
Appear on left side via properties tab (Must drill down)
Ranking: But less property options
Properties Tab on Left:
Have to click on option to see pull down’s
Contexts now different
Prompting options far more powerful and easy to use
Formulas/Variables:
Includes most Deski functions now
IF is a Function (Not a command): Like Excel
Display Format: More Difficult
Tabs on Left: Data/Functions/Operators
Formula on Right/Bottom
Name/Definition on Right/Top
Operators list remains fixed
Subquery Done Via Toolbar Option (Not in conditions)
Linking Multiple Data Providers: Merge Dimensions
New Toolbar Option
Easy to Use Menu
Drilling: Will Drill via New Query to lower level
Snapshot more limited
Friday, July 25, 2008
Universe and Report Design Guidelines and Practices
The document is a compilation of learnings that can be used as Guideline and Best Practices for Report & Universe Design.
Universe Design: Guidelines & Best Practices
Introduction
Gives the basic guidelines/practices that could be followed in any Universe Design
Connection
--> When using a repository, always define a SECURED Connection to the Database.
--> Use the Universe Property panel to define the Universe Use and Version (last update).
--> Define the Connection Name that helps for Easy Database Identification.
Class
--> Define Universe Classes / Subclasses as per the business logic & Naming Convetion.
--> AVOID Auto Class generation in the Designer.
--> Give description for the use of each Class/SubClass.
--> Avoid deep level of subclasses as it reduces the navigability and usability.
Objects
--> Object to be used in calculation HAS to be Measure Objects.
--> Object to be used in Analysis HAS to be Dimension Objects.
--> Give description for the use of each Object.
--> Include an Eg. In the description for Objects used in LOV.
--> Do not set LOV Option for each Dimension. Use it only for required Objects, esp. those to be used in Report Prompts.
--> Keep "Automatic Refresh before Use" option clicked for LOV Objects:
--> If LOV is editable by the user, provide a significant name to List Name under object properties.
--> All the measure objects should use aggregate functions.
--> Avoid having dupicate Object names (in different classes).
Predefined Conditions
--> Give description for the use of each pre-defined condition.
--> If Condition is resulting in a Prompt, make sure associated Dimension Object has LOV.
Tables
--> Alias Tables should be named with proper functional use.
--> Arrange the tables in the Structure as per Business/Functional logic. This helps other Universe users in understanding.
Joins & Context
--> AVOID keeping hanging (not joined) tables in the structure.
--> AVOID having joins that are not part of any context.
--> Give proper functional naming to the context for easy identification.
--> AVOID having 1:1 joins.
Import/Export
--> Make sure of the path for Import, which usually is always in the Business Objects' Universe folder.
--> LOCK the universe if Administrator/Designer does not want any user to Import/Export.
--> DO "Integrity Check" before Exporting the Universe.
--> Good to have correct folder structure , so that you can have a secured environment.
Migration
--> Better take a backup of the repository and then proceed with the migration in BO5.X and BO6.X Version
Report Design: Guidelines & Best Practices
Introduction
Gives the basic guidelines/practices that could be followed in any Report Design.
General
--> Give meaningful names for the report tabs --> For complex reports, keep an overview report tab explaining the report --> Use the Report properties to give more information about the report
Dataproviders
--> Each Dataprovider should be given a name that reflects the usage of the data its going to fetch.
--> Select Objects in such a fashion that the resulting SQL gives a hierarchial order of Tables. This helps to achieve SQL Optimisation.
--> Avoid bringing lot of data into the report which will unnecessarily slow down the report performance.
Report Variables
--> Follow the naming convention of "var_" as prefix to each report level variable. This helps to identify Report Variables different from Universe Objects.
--> Each variable that carries a calculation involving division should have IF <> 0 THEN
Universe Design: Guidelines & Best Practices
Introduction
Gives the basic guidelines/practices that could be followed in any Universe Design
Connection
--> When using a repository, always define a SECURED Connection to the Database.
--> Use the Universe Property panel to define the Universe Use and Version (last update).
--> Define the Connection Name that helps for Easy Database Identification.
Class
--> Define Universe Classes / Subclasses as per the business logic & Naming Convetion.
--> AVOID Auto Class generation in the Designer.
--> Give description for the use of each Class/SubClass.
--> Avoid deep level of subclasses as it reduces the navigability and usability.
Objects
--> Object to be used in calculation HAS to be Measure Objects.
--> Object to be used in Analysis HAS to be Dimension Objects.
--> Give description for the use of each Object.
--> Include an Eg. In the description for Objects used in LOV.
--> Do not set LOV Option for each Dimension. Use it only for required Objects, esp. those to be used in Report Prompts.
--> Keep "Automatic Refresh before Use" option clicked for LOV Objects:
--> If LOV is editable by the user, provide a significant name to List Name under object properties.
--> All the measure objects should use aggregate functions.
--> Avoid having dupicate Object names (in different classes).
Predefined Conditions
--> Give description for the use of each pre-defined condition.
--> If Condition is resulting in a Prompt, make sure associated Dimension Object has LOV.
Tables
--> Alias Tables should be named with proper functional use.
--> Arrange the tables in the Structure as per Business/Functional logic. This helps other Universe users in understanding.
Joins & Context
--> AVOID keeping hanging (not joined) tables in the structure.
--> AVOID having joins that are not part of any context.
--> Give proper functional naming to the context for easy identification.
--> AVOID having 1:1 joins.
Import/Export
--> Make sure of the path for Import, which usually is always in the Business Objects' Universe folder.
--> LOCK the universe if Administrator/Designer does not want any user to Import/Export.
--> DO "Integrity Check" before Exporting the Universe.
--> Good to have correct folder structure , so that you can have a secured environment.
Migration
--> Better take a backup of the repository and then proceed with the migration in BO5.X and BO6.X Version
Report Design: Guidelines & Best Practices
Introduction
Gives the basic guidelines/practices that could be followed in any Report Design.
General
--> Give meaningful names for the report tabs --> For complex reports, keep an overview report tab explaining the report --> Use the Report properties to give more information about the report
Dataproviders
--> Each Dataprovider should be given a name that reflects the usage of the data its going to fetch.
--> Select Objects in such a fashion that the resulting SQL gives a hierarchial order of Tables. This helps to achieve SQL Optimisation.
--> Avoid bringing lot of data into the report which will unnecessarily slow down the report performance.
Report Variables
--> Follow the naming convention of "var_" as prefix to each report level variable. This helps to identify Report Variables different from Universe Objects.
--> Each variable that carries a calculation involving division should have IF
Tuesday, May 13, 2008
brief about Slowly Changing Dimensions
Slowly Changing Dimensions:
The "Slowly Changing Dimension" problem is a common one particular to data warehousing. In a nutshell, this applies to cases where the attribute for a record varies over time. We give an example below:
Christina is a customer with ABC Inc. She first lived in Chicago, Illinois. So, the original entry in the customer lookup table has the following record:
Customer Key Name State
1001 Christina Illinois
At a later date, she moved to Los Angeles, California on January, 2003. How should ABC Inc. now modify its customer table to reflect this change? This is the "Slowly Changing Dimension" problem.
There are in general three ways to solve this type of problem, and they are categorized as follows:
Type 1: The new record replaces the original record. No trace of the old record exists.
Type 2: A new record is added into the customer dimension table. Therefore, the customer is treated essentially as two people.
Type 3: The original record is modified to reflect the change.
Type 1:
We next take a look at each of the scenarios and how the data model and the data looks like for each of them. Finally, we compare and contrast among the three alternatives.
In Type 1 Slowly Changing Dimension, the new information simply overwrites the original information. In other words, no history is kept.
In our example, recall we originally have the following table:
Customer Key Name State
1001 Christina Illinois
After Christina moved from Illinois to California, the new information replaces the new record, and we have the following table:
Customer Key Name State
1001 Christina California
Advantages:
- This is the easiest way to handle the Slowly Changing Dimension problem, since there is no need to keep track of the old information.
Disadvantages:
- All history is lost. By applying this methodology, it is not possible to trace back in history. For example, in this case, the company would not be able to know that Christina lived in Illinois before.
Usage:
About 50% of the time.
When to use Type 1:
Type 1 slowly changing dimension should be used when it is not necessary for the data warehouse to keep track of historical changes.
Type 2:
In Type 2 Slowly Changing Dimension, a new record is added to the table to represent the new information. Therefore, both the original and the new record will be present. The newe record gets its own primary key.
In our example, recall we originally have the following table:
Customer Key Name State
1001 Christina Illinois
After Christina moved from Illinois to California, we add the new information as a new row into the table:
Customer Key Name State
1001 Christina Illinois
1005 Christina California
Advantages:
- This allows us to accurately keep all historical information.
Disadvantages:
- This will cause the size of the table to grow fast. In cases where the number of rows for the table is very high to start with, storage and performance can become a concern.
- This necessarily complicates the ETL process.
Usage:
About 50% of the time.
When to use Type 2:
Type 2 slowly changing dimension should be used when it is necessary for the data warehouse to track historical changes.
Type 3:
In Type 3 Slowly Changing Dimension, there will be two columns to indicate the particular attribute of interest, one indicating the original value, and one indicating the current value. There will also be a column that indicates when the current value becomes active.
In our example, recall we originally have the following table:
Customer Key Name State
1001 Christina Illinois
To accommodate Type 3 Slowly Changing Dimension, we will now have the following columns:
• Customer Key
• Name
• Original State
• Current State
• Effective Date
After Christina moved from Illinois to California, the original information gets updated, and we have the following table (assuming the effective date of change is January 15, 2003):
Customer Key Name Original State Current State Effective Date
1001 Christina Illinois California 15-JAN-2003
Advantages:
- This does not increase the size of the table, since new information is updated.
- This allows us to keep some part of history.
Disadvantages:
- Type 3 will not be able to keep all history where an attribute is changed more than once. For example, if Christina later moves to Texas on December 15, 2003, the California information will be lost.
Usage:
Type 3 is rarely used in actual practice.
When to use Type 3:
Type III slowly changing dimension should only be used when it is necessary for the data warehouse to track historical changes, and when such changes will only occur for a finite number of time.
Monday, May 5, 2008
To create a DBLINK using Derived Tables
1. Create a DBLINK in Oracle on Server1 with the following statement:
2. CREATE DATABASE LINK dblink_name CONNECT TO user_name_on_server2 IDENTIFIED BY password USING 'connect_string_to_server2';
3. Create a synonym for the DBLINK on Server1 using the following statement:
4. CREATE SYNONYM synonym_name FOR user_name_on_server2.table_name_on_server2@dblink_name_server2
5. Ensure the synonym for the linked database on Server1 is added to the tnsnames.ora file of the target database on Server2. If not, Oracle will return the ORA-12154 error message.
6. Log in to Server1.
7. Query the DBLINK synonym using the following SQLPlus statement:
8. SELECT * FROM synonym_name
9. Log into Designer.
10. Click Insert Table > Derived Tables.
11. Query the DBLINK synonym using the following SQLPlus statement:
12. SELECT * FROM synonym_name
13. If an error is returned, close the Derived Tables dialog box and reopen. If the message "Parse OK" is returned, then click OK.
Saturday, March 22, 2008
Tuesday, March 4, 2008
Demo tour on Dashboard and performance Manager
Hi Hope this will usefull to know basic things about dashboard
http://www.businessobjects.com/global/flash/products/xi_tour/index_flash.asp
http://www.businessobjects.com/global/flash/products/xi_tour/index_flash.asp
Friday, February 22, 2008
How does Cognos and Business Objects work with ORACLE?
Business Objects universes are stored in the RDBMS, but in both cases, the cubes are stored externally. Cognos has its own server or desktop based PowerCubes, while Business Objects microcubes are part of a document, which can again be server based or local. These look the same regardless of which database they were sourced from, so the same tools can be used with any database (one of their strengths compared to tools from Oracle, Microsoft or IBM which are database-specific).
As for Oracle OLAP products, the long-established OFA and OSA are still based on Express, which also uses cubes based outside the Oracle database.Oracle9i OLAP Option AW does have cubes and dimensions hosted inside the database, but most Oracle products don't yet build or support such cubes and nor do most third party products (except as vanilla SQL queries).
As for Oracle OLAP products, the long-established OFA and OSA are still based on Express, which also uses cubes based outside the Oracle database.Oracle9i OLAP Option AW does have cubes and dimensions hosted inside the database, but most Oracle products don't yet build or support such cubes and nor do most third party products (except as vanilla SQL queries).
Wednesday, February 20, 2008
Wednesday, February 13, 2008
How do you test your database?
This is a very generic question. I will be describing my generic database testing method as well as stored procedure testing methods.
Testing Databases:
· Table Column data type and data value validation.
· Index implementation and performance improvement.
· Constraints and Rules should be validated for data integrity.
· Application field length and type should match the corresponding database field.
· Database objects like stored procedures, triggers, functions should be tested using different kind of input values and checking the expected output variables.
Testing Stored Procedures:
· Understand the requirements in terms of Business Logic.
· Check that code follows all the coding standards.
· Comparing the fields' requirements of application to the fields retrieved by a stored procedure. They should match.
· Repeatedly run stored procedures many times with different input parameters and compare the output with expected results.
· Pass invalid input parameters and see if a stored procedure has good error handling.
Sunday, February 10, 2008
Thursday, February 7, 2008
Find and remove duplicate rows from a table
One of the most important features of Oracle is the ability to detect and remove duplicate rows from a table. While many Oracle DBA place primary key referential integrity constraints on a table, many shops do not use RI because they need the flexibility.
The most effective way to detect duplicate rows is to join the table against itself as shown below.
SELECT
BOOK_UNIQUE_ID,
PAGE_SEQ_NBR,
IMAGE_KEY
FROM
page_image A
WHERE
rowid >
(SELECT min(rowid) FROM page_image B
WHERE
B.key1 = A.key1
and
B.key2 = A.key2
and
B.key3 = A.key3
);
Please note that you must specify all of the columns that make the row a duplicate in the SQL where clause. Once you have detected the duplicate rows, you may modify the SQL statement to remove the duplicates as shown below:
DELETE FROM
table_name A
WHERE
A.rowid >
ANY (SELECT B.rowid
FROM
table_name B
WHERE
A.col1 = B.col1
AND
A.col2 = B.col2
);
You can also detect and delete duplicate rows using Oracle analytic functions:
delete from
customer
where rowid in
(select rowid from
(select
rowid,
row_number()
over
(partition by custnbr order by custnbr) dup
from customer)
where dup > 1);
Simple syntax to delete duplicate rows from a table
DELETE FROM our_table
WHERE rowid not in
(SELECT MIN(rowid)
FROM our_table
GROUP BY column1, column2, column3... );
Tuesday, February 5, 2008
Overview of Web intelligence
Web Intelligence is designed to help organizations increase trust in decision making by providing
an intuitive, yet powerful, ad hoc query interface for business users and analysts, as well as
interactive viewing and analysis for casual users. With BusinessObjects XI Release 2, Web
Intelligence will introduce powerful new capabilities, making it easier for end users to access,analyze, and share information.
These features include:
1). The ability to access data from multiple universes and synchronize it within a single report (also known as synchronized multiple data providers)
2). The ability to create custom queries including sub queries, combined queries, and edit SQL
3). Support for the vast majority of the full-client formula language functions
4). Report creation features such as data ranking and custom sorts
BusinessObjects full-client capabilities that will be available with
Desktop Intelligence, but not available with Web Intelligence XI Release 2
include:
1). XML or visual basic data providers.
2). Specific power-user query capabilities designed for production reporting requirements.
3). The creation of queries built on the results of other queries.
4). Stored procedures (often used to group a set of SQL statements used in a query). (Note that organizations are now using the derived tables inherent in modern database systems to meet the same needs more efficiently).
5). Some specialized users of the BusinessObjects full-client generate queries using free-hand SQL. (Note that while this is not supported in Web Intelligence XI Release 2, it will be possible to edit existing SQL.) Many organizations are transferring the burden of custom SQL to the derived table method mentioned above. This ensures these specialized results areavailable for all users, and not confined to a single report
Sunday, February 3, 2008
Displaying Row numbers in a Business objects report
Steps to add Row number to business objects report:
1). Create a variable with the following formula:
=runningCount(any variable)
2). Add the Variable to the table as the first column.
Steps to reset the row numbers:
1). Add a second argument to the runningCount function:
=runningCount( ; )
when the value of the reset variable changes , the row count will reset to 0
1). Create a variable with the following formula:
=runningCount(any variable
2). Add the Variable to the table as the first column.
Steps to reset the row numbers:
1). Add a second argument to the runningCount function:
=runningCount(
when the value of the reset variable changes , the row count will reset to 0
Data Warehousing Objects - Fact Table, Dimension Table, Hierarcy Table
Data Warehousing Objects
Fact tables and dimension tables are the two types of objects commonly used in dimensional data warehouse schemas.
Fact tables are the large tables in your warehouse schema that store business measurements. Fact tables typically contain facts and foreign keys to the dimension tables. Fact tables represent data, usually numeric and additive, that can be analyzed and examined. Examples include sales, cost, and profit.
Dimension tables, also known as lookup or reference tables, contain the relatively static data in the warehouse. Dimension tables store the information you normally use to contain queries. Dimension tables are usually textual and descriptive and you can use them as the row headers of the result set. Examples are customers or products.
Fact Tables
A fact table typically has two types of columns: those that contain numeric facts (often called measurements), and those that are foreign keys to dimension tables. A fact table contains either detail-level facts or facts that have been aggregated. Fact tables that contain aggregated facts are often called summary tables. A fact table usually contains facts with the same level of aggregation. Though most facts are additive, they can also be semi-additive or non-additive. Additive facts can be aggregated by simple arithmetical addition. A common example of this is sales. Non-additive facts cannot be added at all. An example of this is averages. Semi-additive facts can be aggregated along some of the dimensions and not along others. An example of this is inventory levels, where you cannot tell what a level means simply by looking at it.
Creating a New Fact Table
You must define a fact table for each star schema. From a modeling standpoint, the primary key of the fact table is usually a composite key that is made up of all of its foreign keys.
Dimension Tables
A dimension is a structure, often composed of one or more hierarchies, that categorizes data. Dimensional attributes help to describe the dimensional value. They are normally descriptive, textual values. Several distinct dimensions, combined with facts, enable you to answer business questions. Commonly used dimensions are customers, products, and time.
Dimension data is typically collected at the lowest level of detail and then aggregated into higher level totals that are more useful for analysis. These natural rollups or aggregations within a dimension table are called hierarchies.
The lookup table provides the detailed information about the attributes. For example, the lookup table for the Quarter attribute would include a list of all of the quarters available in the data warehouse. Each row (each quarter) may have several fields, one for the unique ID that identifies the quarter, and one or more additional fields that specifies how that particular quarter is represented on a report (for example, first quarter of 2001 may be represented as "Q1 2001" or "2001 Q1").
A dimensional model includes fact tables and lookup tables. Fact tables connect to one or more lookup tables, but fact tables do not have direct relationships to one another. Dimensions and hierarchies are represented by lookup tables. Attributes are the non-key columns in the lookup tables.
Hierarchies
Hierarchies are logical structures that use ordered levels as a means of organizing data. A hierarchy can be used to define data aggregation. For example, in a time dimension, a hierarchy might aggregate data from the month level to the quarter level to the year level. A hierarchy can also be used to define a navigational drill path and to establish a family structure.
Within a hierarchy, each level is logically connected to the levels above and below it. Data values at lower levels aggregate into the data values at higher levels. A dimension can be composed of more than one hierarchy. For example, in the product dimension, there might be two hierarchies--one for product categories and one for product suppliers.
Dimension hierarchies also group levels from general to granular. Query tools use hierarchies to enable you to drill down into your data to view different levels of granularity. This is one of the key benefits of a data warehouse.
When designing hierarchies, you must consider the relationships in business structures. For example, a divisional multilevel sales organization.
Hierarchies impose a family structure on dimension values. For a particular level value, a value at the next higher level is its parent, and values at the next lower level are its children. These familial relationships enable analysts to access data quickly.
Below figure illustrates a common example of a sales fact table and dimension tables customers, products, promotions, times, and channels.

Saturday, February 2, 2008
Overview of Chasm and Fan traps (BusinessObjects Universe)
Relational databases can return incorrect results due to limitations in the way that joins are performed in relational databases. Unlike loops, which return fewer rows, the Chasm and the Fan traps are two common circumstances which return too many rows. You can use Designer to resolve both types of problems in your universe schema.
Chasm trap
The Chasm trap occurs when two “many to one” joins converge on a single table. For example a customer can place many orders/and or place many loans.
Fan trap
The Fan trap occurs when a “one to many” join links a table which is in turn linked by another “one to many” join.
For example when you run a query that asks for the total orders by each order line, for a particular customer, an incorrect result is returned as you are performing an aggregate function on the table at the “one” end of the join, while still joining to the “many” end.
Below is the Brief overview:
Chasm Trap:
A chasm occurs when a series of joins crosses a many >- one -< many relationship.
For example:
A >- B -< C
( Employees >-- Showroom --< Salary)
- Each showroom has many employees
- Each showroom has many annual salary figures
The number of employee records should not impact the total salary on the report.
If a query is written that spanned all three of those tables the data from table A and C, there would be duplicated and the measure values would be exaggerated. For example,
- X rows on the left
- Y rows on the right
- X * Y rows in the combined set
Solution 1:
Define a context for each table at the “many” end of the joins.
Context = Meaning
- A context is a sub-set of joins in a universe
- That sub-set of joins has a particular meaning
In our example you could define a context from A to B and from A to C. A context contains each join in the path. This creates two SQL statements and two separate tables in Business Objects, avoiding the creation of a Cartesian product. Using contexts is the most effective way to solve Chasm traps.
Solution 2:
Select the option ‘Multiple SQL Statements for Each Measure’ from the Universe Parameters dialog box in the tool. Only applies to measures. You force the SQL generation engine in Reporter to generate SQL queries for each measure that appears in the Query panel.
Fan Trap:
A fan trap occurs when joins “fan out” over multiple one -< many relationships in a row.
For example:
A -< B -< C (Ex: Customer --< Orders --< Order_Lines)
A fan trap is not quite as severe as a chasm trap. In fact there are many fan traps that can occur in a universe design that can be ignored as long as you control which types of objects you use.
There are two ways to solve a Fan trap problem.
• Using an alias and the aggregate awareness function. This is the most effective way to solve the Fan trap problem.
• Altering the SQL parameters for the universe. This only works for measure objects.
Both of these methods are described below.
Solution 1:
Aliases can resolve chasm traps
- Known as table aliases when writing SQL statements
- Used by BusinessObjects to logically separate the trap into pieces.
You create an alias table and use the aggregate awareness function. You cannot use this option if you have incompatible objects. You can do this as follows:
1. Create an alias for the table that is producing the multiplied aggregation.
2. Create a one to one join between the original table and the alias table.
3. Modify the select statement for the columns that are summed so that the columns in the alias table are summed and not the original table.
4. Apply the @AggregateAware function to the select statement. for example:
@AggregateAware(SUM(ORDERS.TOTAL_VALUE) , SUM(ORDERS_2.TOTAL_VALUE))
Solution 2:
- Create a separate SQL statement per aggregation.
- Aggregations on the same table require only 1 SQL statement.
You select the option ‘Multiple SQL Statements for Each Measure’. You force the SQL generation engine in Reporter to generate separate SQL queries for each measure that appears in the Query panel. You find this option on the SQL page of the Universe Parameters dialog box in the tool.
Overview of BusinessObjects CMS (Central Management Server)
The Central Management Server (CMS) is the key Component within Xi, handling security and the routing of requests to other services.
If the CMS is not running, then users will not be able to log into Business Objects.
The Central Management Server maintains a database of information that allows you to manage the BusinessObjects Enterprise Infrastructure.
The CMS has four main functions:
If the CMS is not running, then users will not be able to log into Business Objects.
The Central Management Server maintains a database of information that allows you to manage the BusinessObjects Enterprise Infrastructure.
The CMS has four main functions:
- Maintains security (users)
- Manages objects (folders, reports, and program objects)
- Manages servers (services)
- Manages auditing (system auditor).
Friday, February 1, 2008
Overview of Report Design
Report Design:
Guidelines & Best Practices:
Introduction:
Gives the basic guidelines/practices that could be followed in any Report Design.
General
--> Give meaningful names for the report tabs
--> For complex reports, keep an overview report tab explaining the report
--> Use the Report properties to give more information about the report
Dataproviders
--> Each Dataprovider should be given a name that reflects the usage of the data its going to fetch.
--> Select Objects in such a fashion that the resulting SQL gives a hierarchial order of Tables. This helps to achieve SQL Optimisation.
--> Avoid bringing lot of data into the report which will unnecessarily slow down the report performance.
Report Variables
--> Follow the naming convention of "var_" as prefix to each report level variable. This helps to identify Report Variables different from Universe Objects.
--> Each variable that carries a calculation involving division should have IF <> 0 THEN
Guidelines & Best Practices:
Introduction:
Gives the basic guidelines/practices that could be followed in any Report Design.
General
--> Give meaningful names for the report tabs
--> For complex reports, keep an overview report tab explaining the report
--> Use the Report properties to give more information about the report
Dataproviders
--> Each Dataprovider should be given a name that reflects the usage of the data its going to fetch.
--> Select Objects in such a fashion that the resulting SQL gives a hierarchial order of Tables. This helps to achieve SQL Optimisation.
--> Avoid bringing lot of data into the report which will unnecessarily slow down the report performance.
Report Variables
--> Follow the naming convention of "var_" as prefix to each report level variable. This helps to identify Report Variables different from Universe Objects.
--> Each variable that carries a calculation involving division should have IF
what is Designer and Creation Of Universe?
What is Designer?
Designer is a BusinessObjects IS module used by universe designers to create and maintain universes. Universes are the semantic layer that isolates end users from the technical issues of the database structure. Universe designers can distribute universes to end users by moving them as files through the file system, or by exporting them to the repository.
BO Universe is essentially a connection layer sitting between the source data and the DW. It is defined by the data mapping or schema or the relationship between database tables. Each universe is accessed by certain category of users. For example, finance people will access finance universe, sales people will access sales universe. The analogy is similar to a data mart.
The advantge of the BO universe is that if there are any changes in the source data structure, this change needs to be made only in the Universe and its effect gets pushed down to all the reports emanating from this universe. A good universe design helps is improving speed and contributes to the Best Practices using BO.
How do you design a universe?
The design method consists of two major phases.
During the first phase, you create the underlying database structure of your universe. This structure includes the tables and columns of a database and the joins by which they are linked. You may need to resolve loops which occur in the joins using aliases or contexts. You can conclude this phase by testing the integrity of the overall structure.
During the second phase, you can proceed to enhance the components of your universe. You can also prepare certain objects for multidimensional analysis. As with the first phase, you should test the integrity of your universe structure. Finally, you can distribute your universes to users by exporting them to the repository or via your file system.
Tuesday, January 29, 2008
What you need to be a Business Intelligence Consultant ??
I read this article recently here the author Reinald Bormann from Harvey jones system gives and insight about the BI Consultant
Most recruiters daily face the sad reality that there is a serious skills shortage in the local IT industry.
The business intelligence (BI) market is not exempt. With BI going from strength to strength since 2003, market-savvy IT professionals are trying to enter this lucrative market, with many cross-skilling on multiple BI platforms or products.
One of the changes afoot in the market is that companies no longer simply deliver a BI solution and then leave clients to their own devices.more often than not, client/consultant relationships extend well beyond delivering the initial project.
Successful BI consultants must be well-rounded people with solid project experience, preferably across various market sectors.
Successful BI consultants should excel in the following four areas:
* Technical ability
* Interpersonal skills
* Project experience and
* Market knowledge
Technical ability
BI projects are being completed quicker today than they were three years ago, with the result that top BI consultants can work on multiple projects each year.
Properly applying the latest technology should always be a BI consultant's highest priority and, with so many technical components to these solutions, specialising in at least one component is beneficial.
While core skills allow consultants to work on projects other than BI, they should always strive to improve their abilities on other components.
Interpersonal skills
All projects involve interaction between BI consultants, fellow team members and clients.
Interpersonal communication is a vital skill that each BI consultant must master.
The wealth of knowledge contained in BI consultants' heads is not easily transferred.
Effective use of communication skills allows them to share knowledge across the team.
Successful BI consultants also act as mentors and guide internal IT teams through the uncharted waters of their first BI projects. It is BI consultants' role to point clients toward good resources, books and conferences for further education.
Project experience
IT consulting is always evolving. Because project rotation is generally more frequent than in the past, BI consultants must quickly understand new businesses in order to deliver solutions on time and within budget. Getting to grips with unfamiliar businesses is always difficult, but is also very rewarding.
Successful BI consultants leverage their technical capabilities to re-use certain components developed on previous projects.
Essentially, project experience breeds problem identification and reinforces the use of best practice and methodology.
Market knowledge
Just as consultants become comfortable, a new product or toolset emerges, which nine times out of 10 changes the way they deliver. This is not necessarily a bad thing, as successful BI consultants usually make market changes work for them by aligning their technical skills in the new direction.
The release of Microsoft Performance Point Server (PPS) at the end of the year is a very good case in point; most BI organisations are uncertain of the true impact PPS will have in the market, so having skilled BI consultants at hand when the product is released could ensure a significant market share of new BI solutions on PPS.
It should be every BI consultant's goal to be as active as possible in the community. That means attending seminars and Webcasts, taking part in BI forums or using other knowledge-sharing channels.
Conclusion
In today's challenging and demanding BI market, successful BI consultants must be well-rounded and experienced people, able to adapt quickly to various business environments, continuously share knowledge internally and externally, understand future BI market trends and, most importantly, be very sound technically.
If you are lucky enough to have such a person in your employ or can find one, hang on to them tightly with both hands as they are worth their weight in gold.
By Reinald Bormann, BI consultant at Harvey Jones Systems
Business Objects-Scheduling Servers
If you have a situation of restarting BO Servers on every Sunday for maintenance purpose you can use this piece of code which will automate BO Servers.
You can add in the scheduled task of the windows,so that it will run at that time.
**************************************************
**************************************************
clse
cho off
echo .
echo .
echo Starting all the BOXIR2 services
echo .
echo .
net start “Central Management Server”
net stop “Connection Server”
net start “Connection Server”
net stop “Crystal Reports Cache Server”
net start “Crystal Reports Cache Server”
net stop “Crystal Reports Job Server”
net start “Crystal Reports Job Server”
net stop “Crystal Reports Page Server”
net start “Crystal Reports Page Server”
net stop “Desktop Intelligence Cache Server”
net start “Desktop Intelligence Cache Server”
net stop “Desktop Intelligence Job Server”
net start “Desktop Intelligence Job Server”
net stop “Desktop Intelligence Report Server”
net start “Desktop Intelligence Report Server”
net stop “Destination Job Server”
net start “Destination Job Server”
net stop “Event Server”
net start “Event Server”
net stop “Input File Repository Server”
net start “Input File Repository Server”
net stop “List of Values Job Server”
net start “List of Values Job Server”
net stop “Output File Repository Server”
net start “Output File Repository Server”
net stop “Program Job Server”
net start “Program Job Server”
net stop “Report Application Server”
net start “Report Application Server”
net stop “Web Intelligence Job Server”
net start “Web Intelligence Job Server”
net stop “Web Intelligence Report Server”
net start “Web Intelligence Report Server”
net stop “WinHTTP Web Proxy Auto-Discovery Service”
net start “WinHTTP Web Proxy Auto-Discovery Service”
echo .
echo .
echo All services has been restarted.
echo .
echo .
pause
**************************************************
*************************************************
Once you written this above statement in the notepad ,save the notepad as a bacth file ("bo.bat").
Then you can add this batch file in the windows scheduled task.so if you want to restart your servers after any any patch install or for any purpose you can use this batch file.
To create a Schedule Task
Go to Start->Settings->Control panel ->Scheduled Task
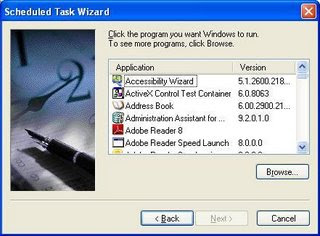
Now give the path and name of the batch file then schedule it
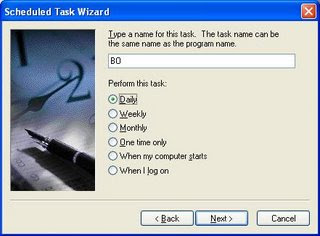
Once it is done then the servers will get restarted automatically at that particular time.
Monday, January 28, 2008
A Model Enterprise BI Flow:
A Model Enterprise BI Flow:
1. Enterprise Information Management
EIM builds a trusted foundation for your business decisions by integrating data from many sources and improving its quality.
- Ensure a required data collection model for all processes across all facilities and geographical locations
- If data is in disparate data sources, seamlessly integrate them into a data warehouse through robust sophisticated data integration tools
- Design information universes to define or restrict information visibility to different departments and personnel and balance data access loads.
- Information so presented is semantic and as per the business terminology, insulating the business user from the underlying technical complexities or need for SQL knowledge.
- The ground for single version of information throughout the organization is now created.
2. Query and Analysis
Ad-hoc query and analysis tools allow end users to interact with business information and answer ad-hoc questions themselves, without advanced knowledge of the underlying data sources and structures.
- Analysts can now work on this data using robust visual analytics to ensure that only the relevant information reaches the key managers as desired.
3. Enterprise Reporting
User-friendly visual reporting tools with drag-and-drop, slice-and-dice, and drill-down capabilities allow users to access, format, and deliver data as meaningful information to large populations of information consumers both inside and outside the organization.
4. Enterprise Performance Management
Performance management tools and services help users align with organizational strategy by tracking and analyzing key business metrics and goals via management dashboards, scorecards, analytics, and alerting.
Enterprises adopting such tightly integrated Business Intelligence solution can now robustly resolve their business concerns and move towards leadership position.

Basic Oracle Q/A
1. What are the components of Physical database structure of Oracle Database?.
ORACLE database is comprised of three types of files. One or more Data files, two are more Redo Log files, and one or more Control files.
2. What are the components of Logical database structure of ORACLE database?
Tablespaces and the Database's Schema Objects.
3. What is a Tablespace?
A database is divided into Logical Storage Unit called tablespaces. A tablespace is used to grouped related logical structures together.
4. What is SYSTEM tablespace and When is it Created?
Every ORACLE database contains a tablespace named SYSTEM, which is automatically created when the database is created. The SYSTEM tablespace always contains the data dictionary tables for the entire database.
5. Explain the relationship among Database, Tablespace and Data file.
Each databases logically divided into one or more tablespaces One or more data files are explicitly created for each tablespace.
6. What is schema?
A schema is collection of database objects of a User.
7. What are Schema Objects ?
Schema objects are the logical structures that directly refer to the database's data. Schema objects include tables, views, sequences, synonyms, indexes, clusters, database triggers, procedures, functions packages anddatabase links.
8. Can objects of the same Schema reside in different tablespaces.?
Yes.
9. Can a Tablespace hold objects from different Schemes ?
Yes.
10. what is Table ?
A table is the basic unit of data storage in an ORACLE database. The tables of a database hold all of the user accessible data. Table data is stored in rows and columns.
11. What is a View ?
A view is a virtual table. Every view has a Query attached to it. (The Query is a SELECT statement that identifies the columns and rows of the table(s) the view uses.)
12. Do View contain Data ?
Views do not contain or store data.
13. Can a View based on another View ?
Yes.
14. What are the advantages of Views ?
Provide an additional level of table security, by restricting access to a predetermined set of rows and columns of a table.
Hide data complexity.
Simplify commands for the user.
Present the data in a different perpecetive from that of the base table.
Store complex queries.
15. What is a Sequence ?
A sequence generates a serial list of unique numbers for numerical columns of a database's tables.
16. What is a Synonym ?
A synonym is an alias for a table, view, sequence or program unit.
17. What are the type of Synonyms?
There are two types of Synonyms Private and Public.
18. What is a Private Synonyms ?
A Private Synonyms can be accessed only by the owner.
19. What is a Public Synonyms ?
A Public synonyms can be accessed by any user on the database.
20. What are synonyms used for ?
Synonyms are used to : Mask the real name and owner of an object.
Provide public access to an object
Provide location transparency for tables,views or program units of a remote database.
Simplify the SQL statements for database users.
21. What is an Index ?
An Index is an optional structure associated with a table to have direct access to rows,which can be created to increase the performance of data retrieval. Index can be created on one or more columns of a table.
22. How are Indexes Update ?
Indexes are automatically maintained and used by ORACLE. Changes to table data are automatically incorporated into all relevant indexes.
23. What are Clusters ?
Clusters are groups of one or more tables physically stores together to share common columns and are often used together.
24. What is cluster Key ?
The related columns of the tables in a cluster is called the Cluster Key.
25. What is Index Cluster ?
A Cluster with an index on the Cluster Key.
26. What is Hash Cluster ?
A row is stored in a hash cluster based on the result of applying a hash function to the row's cluster key value. All rows with the same hash key value are stores together on disk.
27. When can Hash Cluster used ?
Hash clusters are better choice when a table is often queried with equality queries. For such queries the specified cluster key value is hashed. The resulting hash key value points directly to the area on disk that stores the specified rows.
28. What is Database Link ?
A database link is a named object that describes a "path" from one database to another.
29. What are the types of Database Links ?
Private Database Link, Public Database Link and Network Database Link.
30. What is Private Database Link ?
Private database link is created on behalf of a specific user. A private database link can be used only when the owner of the link specifies a global object name in a SQL statement or in the definition of the owner's views or procedures.
31. What is Public Database Link ?
Public database link is created for the special user group PUBLIC. A public database link can be used when any user in the associated database specifies a global object name in a SQL statement or object definition.
3
2. What is Network Database link ?
Network database link is created and managed by a network domain service. A network database link can be used when any user of any database in the network specifies a global object name in a SQL statement or object definition.
33. What is Data Block ?
ORACLE database's data is stored in data blocks. One data block corresponds to a specific number of bytes of physical database space on disk.
34. How to define Data Block size ?
A data block size is specified for each ORACLE database when the database is created. A database users and allocated free database space in ORACLE datablocks. Block size is specified in INIT.ORA file and cann't be changed latter.
35. What is Row Chaining ?
In Circumstances, all of the data for a row in a table may not be able to fit in the same data block. When this occurs , the data for the row is stored in a chain of data block (one or more) reserved for that segment.
36. What is an Extent ?
An Extent is a specific number of contiguous data blocks, obtained in a single allocation, used to store a specific type of information.
37. What is a Segment ?
A segment is a set of extents allocated for a certain logical structure.
38. What are the different type of Segments ?
Data Segment, Index Segment, Rollback Segment and Temporary Segment.
39. What is a Data Segment ?
Each Non-clustered table has a data segment. All of the table's data is stored in the extents of its data segment. Each cluster has a data segment. The data of every table in the cluster is stored in the cluster's data segment.
40. What is an Index Segment ?
Each Index has an Index segment that stores all of its data.
41. What is Rollback Segment ?
A Database contains one or more Rollback Segments to temporarily store "undo" information.
42. What are the uses of Rollback Segment ?
Rollback Segments are used :
To generate read-consistent database information during database recovery to rollback uncommitted transactions for users.
43. What is a Temporary Segment ?
Temporary segments are created by ORACLE when a SQL statement needs a temporary work area to complete execution. When the statement finishes execution, the temporary segment extents are released to the system for future use.
44. What is a Data File ?
Every ORACLE database has one or more physical data files. A database's data files contain all the database data. The data of logical database structures such as tables and indexes is physically stored in the data files allocated for a database.
45. What are the Characteristics of Data Files ?
A data file can be associated with only one database.Once created a data file can't change size.
One or more data files form a logical unit of database storage called a tablespace.
46. What is a Redo Log ?
The set of Redo Log files for a database is collectively known as the database's redo log.
47. What is the function of Redo Log ?
The Primary function of the redo log is to record all changes made to data.
48. What is the use of Redo Log Information ?
The Information in a redo log file is used only to recover the database from a system or media failure prevents database data from being written to a database's data files.
49. What does a Control file Contain ?
A Control file records the physical structure of the database. It contains the following information.
Database Name
Names and locations of a database's files and redolog files.
Time stamp of database creation.
50. What is the use of Control File ?
When an instance of an ORACLE database is started, its control file is used to identify the database and redo log files that must be opened for database operation to proceed. It is also used in database recovery.
51. What is a Data Dictionary ?
The data dictionary of an ORACLE database is a set of tables and views that are used as a read-only reference about the database.
It stores information about both the logical and physical structure of the database, the valid users of an ORACLE database, integrity constraints defined for tables in the database and space allocated for a schema object and how much of it is being used.
52. What is an Integrity Constrains ?
An integrity constraint is a declarative way to define a business rule for a column of a table.
53. Can an Integrity Constraint be enforced on a table if some existing table data does not satisfy the constraint ?
No.
54. Describe the different type of Integrity Constraints supported by ORACLE ?
NOT NULL Constraint - Disallows NULLs in a table's column.
UNIQUE Constraint - Disallows duplicate values in a column or set of columns.
PRIMARY KEY Constraint - Disallows duplicate values and NULLs in a column or set of columns.
FOREIGN KEY Constrain - Require each value in a column or set of columns match a value in a related table's UNIQUE or PRIMARY KEY.
CHECK Constraint - Disallows values that do not satisfy the logical expression of the constraint.
55. What is difference between UNIQUE constraint and PRIMARY KEY constraint ?
A column defined as UNIQUE can contain NULLs while a column defined as PRIMARY KEY can't contain Nulls.
56. Describe Referential Integrity ?
A rule defined on a column (or set of columns) in one table that allows the insert or update of a row only if the value for the column or set of columns (the dependent value) matches a value in a column of a related table (the referenced value). It also specifies the type of data manipulation allowed on referenced data and the action to be performed on dependent data as a result of any action on referenced data.
57. What are the Referential actions supported by FOREIGN KEY integrity constraint ?
UPDATE and DELETE Restrict - A referential integrity rule that disallows the update or deletion of referenced data.
DELETE Cascade - When a referenced row is deleted all associated dependent rows are deleted.
58. What is self-referential integrity constraint ?
If a foreign key reference a parent key of the same table is called self-referential integrity constraint.
59. What are the Limitations of a CHECK Constraint ?
The condition must be a Boolean expression evaluated using the values in the row being inserted or updated and can't contain subqueries, sequence, the SYSDATE,UID,USER or USERENV SQL functions, or the pseudo columns LEVEL or ROWNUM.
60. What is the maximum number of CHECK constraints that can be defined on a column ?
No Limit.
SYSTEM ARCHITECTURE :
61. What constitute an ORACLE Instance ?
SGA and ORACLE background processes constitute an ORACLE instance. (or) Combination of memory structure and background process.
62. What is SGA ?
The System Global Area (SGA) is a shared memory region allocated by ORACLE that contains data and control information for one ORACLE instance.
63. What are the components of SGA ?
Database buffers, Redo Log Buffer the Shared Pool and Cursors.
64. What do Database Buffers contain ?
Database buffers store the most recently used blocks of database data. It can also contain modified data that has not yet been permanently written to disk.
65. What do Redo Log Buffers contain ?
Redo Log Buffer stores redo entries a log of changes made to the database.
66. What is Shared Pool ?
Shared Pool is a portion of the SGA that contains shared memory constructs such as shared SQL areas.
67. What is Shared SQL Area ?
A Shared SQL area is required to process every unique SQL statement submitted to a database and contains information such as the parse tree and execution plan for the corresponding statement.
68. What is Cursor ?
A Cursor is a handle ( a name or pointer) for the memory associated with a specific statement.
69. What is PGA ?
Program Global Area (PGA) is a memory buffer that contains data and control information for a server process.
70. What is User Process ?
A user process is created and maintained to execute the software code of an application program. It is a shadow process created automatically to facilitate communication between the user and the server process.
71. What is Server Process ?
Server Process handle requests from connected user process. A server process is in charge of communicating with the user process and interacting with ORACLE carry out requests of the associated user process.
72. What are the two types of Server Configurations ?
Dedicated Server Configuration and Multi-threaded Server Configuration.
73. What is Dedicated Server Configuration ?
In a Dedicated Server Configuration a Server Process handles requests for a Single User Process.
74. What is a Multi-threaded Server Configuration ?
In a Multi-threaded Server Configuration many user processes share a group of server process.
75. What is a Parallel Server option in ORACLE ?
A configuration for loosely coupled systems where multiple instance share a single physical database is called Parallel Server.
76. Name the ORACLE Background Process ?
DBWR - Database Writer.
LGWR - Log Writer
CKPT - Check Point
SMON - System Monitor
PMON - Process Monitor
ARCH - Archiver
RECO - Recover
Dnnn - Dispatcher, and
LCKn - Lock
Snnn - Server.
77. What Does DBWR do ?
Database writer writes modified blocks from the database buffer cache to the data files.
78.When Does DBWR write to the database ?
DBWR writes when more data needs to be read into the SGA and too few database buffers are free. The least recently used data is written to the data files first. DBWR also writes when CheckPoint occurs.
79. What does LGWR do ?
Log Writer (LGWR) writes redo log entries generated in the redo log buffer of the SGA to on-line Redo Log File.
80. When does LGWR write to the database ?
LGWR writes redo log entries into an on-line redo log file when transactions commit and the log buffer files are full.
81. What is the function of checkpoint(CKPT)?
The Checkpoint (CKPT) process is responsible for signaling DBWR at checkpoints and updating all the data files and control files of the database.
82. What are the functions of SMON ?
System Monitor (SMON) performs instance recovery at instance start-up. In a multiple instance system (one that uses the Parallel Server), SMON of one instance can also perform instance recovery for other instance that have failed SMON also cleans up temporary segments that are no longer in use and recovers dead transactions skipped during crash and instance recovery because of file-read or off-line errors. These transactions are eventually recovered by SMON when the tablespace or file is brought back on-line SMON also coalesces free extents within the database to make free space contiguous and easier to allocate.
83. What are functions of PMON ?
Process Monitor (PMON) performs process recovery when a user process fails PMON is responsible for cleaning up the cache and Freeing resources that the process was using PMON also checks on dispatcher and server processes and restarts them if they have failed.
84. What is the function of ARCH ?
Archiver (ARCH) copies the on-line redo log files to archival storage when they are full. ARCH is active only when a database's redo log is used in ARCHIVELOG mode.
85. What is function of RECO ?
RECOver (RECO) is used to resolve distributed transactions that are pending due to a network or system failure in a distributed database. At timed intervals,the local RECO attempts to connect to remote databases and automatically complete the commit or rollback of the local portion of any pending distributed transactions.
86. What is the function of Dispatcher (Dnnn) ?
Dispatcher (Dnnn) process is responsible for routing requests from connected user processes to available shared server processes and returning the responses back to the appropriate user processes.
87. How many Dispatcher Processes are created ?
Atleast one Dispatcher process is created for every communication protocol in use.
88. What is the function of Lock (LCKn) Process ?
Lock (LCKn) are used for inter-instance locking when the ORACLE Parallel Server option is used.
89. What is the maximum number of Lock Processes used ?
Though a single LCK process is sufficient for most Parallel Server systems
upto Ten Locks (LCK0,....LCK9) are used for inter-instance locking.
DATA ACCESS
90. Define Transaction ?
A Transaction is a logical unit of work that comprises one or more SQL statements executed by a single user.
91. When does a Transaction end ?
When it is committed or Rollbacked.
92. What does COMMIT do ?
COMMIT makes permanent the changes resulting from all SQL statements in the transaction. The changes made by the SQL statements of a transaction become visible to other user sessions transactions that start only after transaction is committed.
93. What does ROLLBACK do ?
ROLLBACK retracts any of the changes resulting from the SQL statements in the transaction.
94. What is SAVE POINT ?
For long transactions that contain many SQL statements, intermediate markers or savepoints can be declared which can be used to divide a transaction into smaller parts. This allows the option of later rolling back all work performed from the current point in the transaction to a declared savepoint within the transaction.
95. What is Read-Only Transaction ?
A Read-Only transaction ensures that the results of each query executed in the transaction are consistant with respect to the same point in time.
96. What is the function of Optimizer ?
The goal of the optimizer is to choose the most efficient way to execute a SQL statement.
97. What is Execution Plan ?
The combinations of the steps the optimizer chooses to execute a statement is called an execution plan.
98. What are the different approaches used by Optimizer in choosing an execution plan ?
Rule-based and Cost-based.
99. What are the factors that affect OPTIMIZER in choosing an Optimization approach ?
The OPTIMIZER_MODE initialization parameter Statistics in the Data Dictionary the OPTIMIZER_GOAL parameter of the ALTER SESSION command hints in the statement.
100. What are the values that can be specified for OPTIMIZER MODE Parameter ?
COST and RULE.
101. Will the Optimizer always use COST-based approach if OPTIMIZER_MODE is set to "Cost'?
Presence of statistics in the data dictionary for atleast one of the tables accessed by the SQL statements is necessary for the OPTIMIZER to use COST-based approach. Otherwise OPTIMIZER chooses RULE-based approach.
102. What is the effect of setting the value of OPTIMIZER_MODE to 'RULE' ?
This value causes the optimizer to choose the rule_based approach for all SQL statements issued to the instance regardless of the presence of statistics.
103. What are the values that can be specified for OPTIMIZER_GOAL parameter of the ALTER SESSION Command ?
CHOOSE,ALL_ROWS,FIRST_ROWS and RULE.
104. What is the effect of setting the value "CHOOSE" for OPTIMIZER_GOAL, parameter of the ALTER SESSION Command ?
The Optimizer chooses Cost_based approach and optimizes with the goal of best throughput if statistics for atleast one of the tables accessed by the SQL statement exist in the data dictionary. Otherwise the OPTIMIZER chooses RULE_based approach.
105. What is the effect of setting the value "ALL_ROWS" for OPTIMIZER_GOAL parameter of the ALTER SESSION command ?
This value causes the optimizer to the cost-based approach for all SQL statements in the session regardless of the presence of statistics and to optimize with a goal of best throughput.
106. What is the effect of setting the value 'FIRST_ROWS' for OPTIMIZER_GOAL parameter of the ALTER SESSION command ?
This value causes the optimizer to use the cost-based approach for all SQL statements in the session regardless of the presence of statistics and to optimize with a goal of best response time.
107. What is the effect of setting the 'RULE' for OPTIMIER_GOAL parameter of the ALTER SESSION Command ?
This value causes the optimizer to choose the rule-based approach for all SQL statements in a session regardless of the presence of statistics.
108. What is RULE-based approach to optimization ?
Choosing an executing planbased on the access paths available and the ranks of these access paths.
109. What is COST-based approach to optimization ?
Considering available access paths and determining the most efficient execution plan based on statistics in the data dictionary for the tables accessed by the statement and their associated clusters and indexes.
PROGRAMMATIC CONSTRUCTS
110. What are the different types of PL/SQL program units that can be defined and stored in ORACLE database ?
Procedures and Functions,Packages and Database Triggers.
111. What is a Procedure ?
A Procedure consist of a set of SQL and PL/SQL statements that are grouped together as a unit to solve a specific problem or perform a set of related tasks.
112. What is difference between Procedures and Functions ?
A Function returns a value to the caller where as a Procedure does not.
113. What is a Package ?
A Package is a collection of related procedures, functions, variables and other package constructs together as a unit in the database.
114. What are the advantages of having a Package ?
Increased functionality (for example,global package variables can be declared and used by any proecdure in the package) and performance (for example all objects of the package are parsed compiled, and loaded into memory once)
115. What is Database Trigger ?
A Database Trigger is procedure (set of SQL and PL/SQL statements) that is automatically executed as a result of an insert in,update to, or delete from a table.
116. What are the uses of Database Trigger ?
Database triggers can be used to automatic data generation, audit data modifications, enforce complex Integrity constraints, and customize complex security authorizations.
117. What are the differences between Database Trigger and Integrity constraints ?
A declarative integrity constraint is a statement about the database that is always true. A constraint applies to existing data in the table and any statement that manipulates the table.
A trigger does not apply to data loaded before the definition of the trigger, therefore, it does not guarantee all data in a table conforms to the rules established by an associated trigger.
A trigger can be used to enforce transitional constraints where as a declarative integrity constraint cannot be used.
DATABASE SECURITY
118. What are Roles ?
Roles are named groups of related privileges that are granted to users or other roles.
119. What are the use of Roles ?
REDUCED GRANTING OF PRIVILEGES - Rather than explicitly granting the same set of privileges to many users a database administrator can grant the privileges for a group of related users granted to a role and then grant only the role to each member of the group.
DYNAMIC PRIVILEGE MANAGEMENT - When the privileges of a group must change, only the privileges of the role need to be modified. The security domains of all users granted the group's role automatically reflect the changes made to the role.
SELECTIVE AVAILABILITY OF PRIVILEGES - The roles granted to a user can be selectively enable (available for use) or disabled (not available for use). This allows specific control of a user's privileges in any given situation.
APPLICATION AWARENESS - A database application can be designed to automatically enable and disable selective roles when a user attempts to use the application.
120. How to prevent unauthorized use of privileges granted to a Role ?
By creating a Role with a password.
121. What is default tablespace ?
The Tablespace to contain schema objects created without specifying a tablespace name.
122. What is Tablespace Quota ?
The collective amount of disk space available to the objects in a schema on a particular tablespace.
123. What is a profile ?
Each database user is assigned a Profile that specifies limitations on various system resources available to the user.
124. What are the system resources that can be controlled through Profile ?
The number of concurrent sessions the user can establish the CPU processing time available to the user's session the CPU processing time available to a single call to ORACLE made by a SQL statement the amount of logical I/O available to the user's session the amout of logical I/O available to a single call to ORACLE made by a SQL statement the allowed amount of idle time for the user's session the allowed amount of connect time for the user's session.
125. What is Auditing ?
Monitoring of user access to aid in the investigation of database use.
126. What are the different Levels of Auditing ?
Statement Auditing, Privilege Auditing and Object Auditing.
127. What is Statement Auditing ?
Statement auditing is the auditing of the powerful system privileges without regard to specifically named objects.
128. What is Privilege Auditing ?
Privilege auditing is the auditing of the use of powerful system privileges without regard to specifically named objects.
129. What is Object Auditing ?
Object auditing is the auditing of accesses to specific schema objects without regard to user.
DISTRIBUTED PROCESSING AND DISTRIBUTED DATABASES
130. What is Distributed database ?
A distributed database is a network of databases managed by multiple database servers that appears to a user as single logical database. The data of all databases in the distributed database can be simultaneously accessed and modified.
131. What is Two-Phase Commit ?
Two-phase commit is mechanism that guarantees a distributed transaction either commits on all involved nodes or rolls back on all involved nodes to maintain data consistency across the global distributed database. It has two phase, a Prepare Phase and a Commit Phase.
132. Describe two phases of Two-phase commit ?
Prepare phase - The global coordinator (initiating node) ask a participants to prepare (to promise to commit or rollback the transaction, even if there is a failure)
Commit - Phase - If all participants respond to the coordinator that they are prepared, the coordinator asks all nodes to commit the transaction, if all participants cannot prepare, the coordinator asks all nodes to roll back the transaction.
133. What is the mechanism provided by ORACLE for table replication ?
Snapshots and SNAPSHOT LOGs
134. What is a SNAPSHOT ?
Snapshots are read-only copies of a master table located on a remote node which is periodically refreshed to reflect changes made to the master table.
135. What is a SNAPSHOT LOG ?
A snapshot log is a table in the master database that is associated with the master table. ORACLE uses a snapshot log to track the rows that have been updated in the master table. Snapshot logs are used in updating the snapshots based on the master table.
136. What is a SQL * NET?
SQL *NET is ORACLE's mechanism for interfacing with the communication protocols used by the networks that facilitate distributed processing and distributed databases. It is used in Clint-Server and Server-Server communications.
DATABASE OPERATION, BACKUP AND RECOVERY
137. What are the steps involved in Database Startup ?
Start an instance, Mount the Database and Open the Database.
138. What are the steps involved in Database Shutdown ?
Close the Database, Dismount the Database and Shutdown the Instance.
139. What is Restricted Mode of Instance Startup ?
An instance can be started in (or later altered to be in) restricted mode so that when the database is open connections are limited only to those whose user accounts have been granted the RESTRICTED SESSION system privilege.
140. What are the different modes of mounting a Database with the Parallel Server ?
Exclusive Mode If the first instance that mounts a database does so in exclusive mode, only that Instance can mount the database.
Parallel Mode If the first instance that mounts a database is started in parallel mode, other instances that are started in parallel mode can also mount the database.
141. What is Full Backup ?
A full backup is an operating system backup of all data files, on-line redo log files and control file that constitute ORACLE database and the parameter.
142. Can Full Backup be performed when the database is open ?
No.
143. What is Partial Backup ?
A Partial Backup is any operating system backup short of a full backup, taken while the database is open or shut down.
144.WhatisOn-lineRedoLog?
The On-line Redo Log is a set of tow or more on-line redo files that record all committed changes made to the database. Whenever a transaction is committed, the corresponding redo entries temporarily stores in redo log buffers of the SGA are written to an on-line redo log file by the background process LGWR. The on-line redo log files are used in cyclical fashion.
145. What is Mirrored on-line Redo Log ?
A mirrored on-line redo log consists of copies of on-line redo log files physically located on separate disks, changes made to one member of the group are made to all members.
146. What is Archived Redo Log ?
Archived Redo Log consists of Redo Log files that have archived before being reused.
147. What are the advantages of operating a database in ARCHIVELOG mode over operating it in NO ARCHIVELOG mode ?
Complete database recovery from disk failure is possible only in ARCHIVELOG mode.
Online database backup is possible only in ARCHIVELOG mode.
148. What is Log Switch ?
The point at which ORACLE ends writing to one online redo log file and begins writing to another is called a log switch.
149. What are the steps involved in Instance Recovery ?
R_olling forward to recover data that has not been recorded in data files, yet has been recorded in the on-line redo log, including the contents of rollback segments.
Rolling back transactions that have been explicitly rolled back or have not been committed as indicated by the rollback segments regenerated in step a.
Releasing any resources (locks) held by transactions in process at the time of the failure.
Resolving any pending distributed transactions undergoing a two-phase commit at the time of the instance failure.
What are Dimension-Measure-Detail Objects?
When creating universes, universe designers define and qualify objects. The qualification of an object reveals how it can be used in analysis in reports. An object can be qualified as a dimension, a detail, or a measure.
A dimension object is the object being tracked; in other words, it can be considered the focus of the analysis. A dimension can be an object such as Service, Price, or Customer.Dimension objects retrieve the data that will provide the basis for analysis in a report. Dimension objects typically retrieve character-type data (customer names, resort names, etc.), or dates (years, quarters, reservation dates, etc.)
A detail object provides descriptive data about a dimension object (or attribute of a dimension). It is always associated with a specific dimension object. However, a detail object cannot be used in drill down analysis. E.g. Address & phone number can be attributes about the customer dimension.
A measure object is derived from one of the following aggregate functions:Count, Sum, Minimum, Maximum or average or is a numeric data item on which you can apply, at least locally, one of those functions. This type of object provides statistical information. Examples of measure objects include the following:Revenue, unit price etc
BO XI R2 Architecture (5 Tier's)

We have five tiers in BOXI
1.Client Tier
The client tier is the only part of the BusinessObjects Enterprise system that administrators and end users interact with directly. This tier is made up of the applications that enable people to administer, publish, and view reports and other objects
2.Application tier
The application tier hosts the server-side components that process requests from the client tier as well as the components that communicate these requests to the appropriate server in the intelligence tier
3.Intelligence Tier
The intelligence tier manages the BusinessObjects Enterprise system. It maintains all of the security information, sends requests to the appropriate servers, manages audit information, and stores report instances
4.Processing tier
The processing tier accesses the data and generates the reports. It is the only tier that interacts directly with the databases that contain the report data
5.Data Tier
The data tier is made up of the databases that contain the data used in the reports. BusinessObjects Enterprise supports a wide range of corporate databases
New Features in BO XI R2
New Features in BO XI R2
It's been few months since Business Objects XIr2 has hit the market. Unfortunately I still haven't got a chance to play my hands on it. Today I was reading about some of the new features provided in XIr2 and I was happy to learn about two new features that were most wanted by almost all the users I have dealt with.
1) To be able to email the reports while scheduling using Broadcast Agent- In previous versions of Business Objects we needed to write some macros and do some tweaks at the server to achieve this. But in XIr2, this feature is built-in to the product.
2) To be able to schedule based on a business calendar- This is very common and very realistic from the user's point of view as the business calendar varies from each company and scheduling goes useless without this feature many-a-times.Business Objects is in the market for almost 10 years but they weren't able to put these features all this time. Thanks to Crystal reports who was bought by Business Objects and brought these nice features into Business Objects products too.
Glossary Of Business Objects Terms
Glossary Of Business Objects Terms
Aggregate
A calculation that returns totals, percentages, etc. in which any of the following functions are used:
Average, Count, Max, Min, StdDev, StdDevP, Sum, Var, VarP.
Alerter
Used to highlight data based on conditions set for a particular column by the user. Similar to Conditional Formatting used in Excel.
Block
Generic term used to describe tables, crosstabs and charts containing data from the Data Provider in Business Objects.
Business Answer
An operational result that confirms a report’s accuracy in answering the business question.
Business Objects Report
A document produced by Business Objects that contains both data and formatting.
Business Question
The operational, defined question that guides the building of a query or report.
Case Universe
A view or construct of the ODS organized with respect to information found in and associated with the Case folder in CWS/CMS.
Cell
A rectangular formatting object found in or outside of a block. A Cell contains the value of a variable.
Chart
A visual representation of data from the report’s Data Provider.
Class
A collection of related objects contained in the same folder in a Business Objects universe.
Column
A vertical collection of cells, a column usually provides the values for a particular variable.
Condition
A definition designed to exclude undesirable values from a report, leaving only desired values, e.g., Case End Date Is null excludes closed cases.
Constant
An unchanging value against which a variable is compared, e.g., the constant “3” is used in the condition: Focus Age (Years) Greater than 3.
Count
The number of distinct occurrences in a set of values, e.g., a count of 1, 1,1,2,2,5 returns 3.
Count All
Count of all rows (values) in data, e.g., 1,1,1,2,2,5 returns 6.
Crosstab
A two-dimensional representation of data. Variables are displayed in columns, rows, and (usually a count) in the body.
Cube
Another term for the Data Provider where the data from a query is contained.
Custom Sort
Ordering data in sorts other than ascending (A-Z) and descending (Z-A).
Data Provider
A structure in which the retrieved data is stored in the Business Objects document. The embedded data in a Data Provider is displayed in charts, tables, and crosstabs. A report may have more than one Data Provider.
Data tab
The Data tab is used to manage the variables in your report. You can view this list in two different ways. In alphabetical order, all the variables in the document are listed in alphabetical order with the variables in the Variables folder and the formulas in the Formulas folder. By query, variables are grouped into the queries from which they were returned.
Detail
Provides additional information on an associated object. For example, the object Referral Received Date contains the details: Fed Quarter and State Quarter, among others, to assist in determining the number of referrals received during each of those periods.
Dimension
Key objects you are most likely to base your queries on as either Result Objects or in Conditions. Dimensions are typically character-type data (client names, 19-digit numbers, etc.), or dates (DOB’s, start dates, etc.).
Document
A Business Objects file with the extension “rep.” A document contains both data and formatting.
Drill
A method for exploring or displaying data in progressively greater detail. A very powerful function in Business Objects used for “data mining.”
Edit Data Provider
Also known as the Query Panel, where Result Objects and Conditions can be defined.
Extract Date
The day the data was copied from the production CWS/CMS database to the ODS. It is a useful object to include in a report as it shows readers how current the data is.
Filter
Reduces the amount of data displayed to specific values, e.g., a filter on Case Active Service Component may show only Permanent Placement cases.
Footer
The space at the bottom of the page below the report area used to identify your report and add page information to your report.
Formula
The definition of the contents of a cell, e.g., =. Can contain text, functions (e.g., calculating a date 30 days after a start date), operators, and variables.
Function
Functions are used to create formulas and variables. They are predefined routines to return information in a different form. For example, you have a start date of 04/19/00; use the function Year () to return 2000.
Grid
A matrix of lines placed in the background to aid report layouts.
Header
The space at the top of the page above the report area used to identify your report and add page information to your report.
Map tab
The Map tab is used to manage the structure of your document. It has two views: a navigation view which displays a list of all the reports in the Business Objects document, or a structure view which displays a list of all the components in the selected report.
Measure
Numeric data that is the result of calculations performed on a dimension object in the database, e.g., Case Count is a measure of the number of cases in a given cube.
Null
The absence of data in an attribute, where no value is entered. This is different from an attribute that contains a zero, as a zero is a placeholder created by the system. For example, a case end date that has no value is said to be null (an open case).
Object
A unit that represents a variable in a database. Objects have been created to equal fields in the CWS/CMS database.
ODSxx Universe
A view or construct of the ODS organized using the CWS/CMS database physical names for entities and attributes. Classes are organized by entity (table) and contain the objects that match the attributes (columns) for that entity.
Operand
The object value to be searched for. In the condition Focus Age (Years) Equal to 18, the operand is 18.
Operands (Defined)
· You can create a condition that will compare the object with a Calculation. Some of the functions available include sum, min, max, average, and count.
· Create a subquery (All) and Create a subquery (ANY) allow you to create a query within a query; the subquery returns either all or any values, which are then used in the main query’s conditions.
· Business Objects can compare the values of two different objects using Select an object, such as “Case Plan Approval Date Less than or equal to COHP Start Date.”
· Show a list of prompts allows you to reuse an existing prompt. The user has to enter the value only once in order to complete more than one condition using the same prompt.
· Use Show a list of values to display values associated with the selected variable. Case Active Service Component will display Emergency Response, Family Maintenance, Family Reunification, and Permanent Placement. “Show a list of values” queries the database for values; Case Focus Child DOB will find all the birth dates in your county data.
· Type a new constant will allow entry of a specific value. For example, using “Focus Child Age (Years) Equal to,” you can enter a constant of ‘10’ to show children 10 years old.
· Type a new prompt gives you the ability to create a dialog box in which the user enters values for the conditions (dates, unit names, etc.). “Focus Age (years) Equal to Prompt (‘Enter age of child’)” will display a dialog with the title indicated in parentheses.
Operator
The specification of the relationship between the object and the operand. In the condition “Case Start Date Greater than 01/01/01” the operator is ‘Greater than’.
Operators (Defined)
· Between returns values between two operands. “Referral Received Date Between ‘01/01/00 12:00:00 AM’ and ‘06/30/00 12:00:00 AM’” will retrieve only referrals where the received date falls between the two constants (i.e. first half of 2000).
· Not between is the opposite of “Between,” e.g., “Referral Received Time Not between ‘08:00:00 AM’ and ‘05:00:00 PM’” will find referrals received after hours.
· Both is similar to a combined intersect query. The values returned will be equal to both values specified in the operand. For example, if the condition “Case Service Component Both ‘Emergency Response, Family Maintenance’” is employed, result objects will be returned for cases that have had both ER and FM as service components.
· Different from is the opposite of Equal to. It can be used to exclude variables (e.g., Case Intervention Reason Different from ‘Adoption Services’).
· Use Equal to when the desired object must be a certain value. “Equal to” can be used, for example, to indicate a preferred program (Case Active Service Component Equal to ‘Family Maintenance’), or a particular age (Focus Age (Years) Equal to ‘17’).
· Except is equivalent to a combined minus query. Except will return values that are different from the values specified in the operand, e.g., “Focus Gender Code Except ‘U’” will show focus children identified as either male or female, and not ‘unknowns.’
· Greater than, and Greater than or equal to can be used to establish the lower limit of a variable. For example, “Referral Duration Greater than or equal to ‘30’” will find referrals open thirty days or more.
· In list is the expanded form of “Equal to.” Use it when you want a variable that is included in a set of choices. “Placement Facility Type In list ‘Foster Family Home; FFA-Certified Home; Relative Home’” will find any of those Facility Types.
· The opposite of “In list” is Not in list. The variable is excluded from a list of results, e.g., “Placement Facility Not in list ‘County Shelter/Recv Home; Medical Facility.’
· Is null will return only objects that contain empty rows in the database. For example, “COHP End Date Is null” will only show the Result Objects for cases that have an open placement in the database.
· Is not null is the opposite of “Is null.” The object in the condition must have a value in it. “CP Effective Date Is not null” will show results only for cases with an approved case plan on file.
· Less than and Less than or equal to are used to create the upper limits of a variable. “Victim Age (Years) Less than or equal to ‘3’” can be used to find children with referral allegations who are three years of age and younger.
· Matches pattern will find variables that include the same character string. The condition “Focus Last Name Matches pattern ‘Smith%’ will return result objects such as Smith, Smithsonian, and Smithy. You can use the wildcards “%” (more than one unknown character) and “_” (a single character placeholder).
· You can also employ wildcards in Different from pattern. This operator is the antithesis of “Matches pattern,” excluding values that contain the specified character string.
Personal Data Files
Text, Excel, or Dbase files that can be imported into or exported from Business Objects. A Data Provider may be created from a Personal Data File rather than from a query in a Business Objects universe.
Pivot
A method for changing the axis of a displayed table, in which objects in rows are exchanged with objects in columns.
Predefined Conditions
Conditions built by the universe author; these are usually common conditions and included for convenience. For example, the Case universe contains a predefined condition “Open FM Cases Over 1 Year.” You can apply one or more predefined conditions when you build a query.
Prompt
A dialogue box defined by the report writer in a query’s conditions that requires an entry when the report is refreshed or run. Prompts are handy for reports that are run often, but with changing timeframes.
Purge
Empties data from the cube of a report; does not affect report formatting. Purge your data if you want to share a report with another county, but do not wish to include your county’s data in the report.
Query
A process by which data is retrieved from the database. A set of variables to be returned with associated conditions.
Query Panel
A window in Business Objects where report writers can specify the variables to be returned from a database, and the conditions applied to those variables. Also known as Edit Data Provider.
Referral Universe
A view or construct of the ODS organized with respect to information found in and associated with the Referral folder in CWS/CMS.
Refresh/Run
Updates the data in your report to the latest extract from the database. You can refresh all the data in your report or you can refresh individual cubes from the Data Manager.
Report
The focal point of your work with in Business Objects: where you view, analyze, and format data. A report is equal to a page tab in a Business Objects document, and there can be more than one in a document.
Report Manager
A key part of the Business Objects workspace that enables you to manage many different aspects of your work in Business Objects quickly and easily. It has two tabs: the Data tab is used to manage all the variables in your report, and the Map tab is used to work on the structure and formatting of report components.
Result Objects
The area of the Query Panel where objects are placed for the purposes of retrieving values.
Row
A record of a table. A row is created for each record added to the database, e.g., a new case on the case table.
Save And Close
An option available in the Query Panel, which allows the query to be saved without retrieving data. This is very helpful when creating large and/or multiple queries, and you need to save the Query Panel but do not want to wait for Business Objects to retrieve all records.
Scope Of Analysis
A subset of data returned by a query that you would use for analysis in your report. The data for your scope of analysis does not appear in the report until you use it in analysis.
The scope of analysis you can define depends on hierarchies in the universe. A hierarchy, which the designer sets up when creating the universe consists of dimension objects ranked from less detailed to more detailed. For example, the Service Component hierarchy in the Case universe consists of the following dimension objects: Case Active Service Component, Focus Primary Ethnicity, Focus Primary Language, Focus Gender Code, Focus Age (Years), Pri Staff Name Formatted, Case Name, & Case ID Number. You select dimension objects that belong to hierarchies to define the scope of analysis.
Slice and Dice
A user-friendly, graphical way of analyzing data. It displays the contents of the current report, and enables you to:
· Add, move and remove data.
· Switch between block types, e.g., turning tables into crosstabs.
· Build and edit master/detail reports.
· Apply, edit, and remove breaks, filters, sorts, ranking and calculations.
Snap to grid
Activates a grid for positioning blocks and/or master cells with precision. Snap to Grid is a toggle command, which either activates or deactivates the grid. When you activate the grid and move a block or master cell in the report, it is automatically aligned to the closest grid intersection.
Subquery
As part of a larger query, subqueries retrieve data with their own set of conditions, and then apply that data to the primary query in one of three ways. Subqueries can be union, intersection, or minus.
Table
A collection of associated information in a database stored in rows. Tables are also called entities in the CWS/CMS database.
Time encapsulation
A report-writing method by which data is retrieved only for variables during a given period of time. Using prompts in your conditions, as well as taking into account start and end dates, help you define a time encapsulation.
Universe
In Business Objects, a logical construct of classes and objects, and the links connecting them, that defines a view of CWS/CMS data.
Variable
A named formula. Business Objects includes predefined variables (objects) in its universes, or you may create your own variables.
Aggregate
A calculation that returns totals, percentages, etc. in which any of the following functions are used:
Average, Count, Max, Min, StdDev, StdDevP, Sum, Var, VarP.
Alerter
Used to highlight data based on conditions set for a particular column by the user. Similar to Conditional Formatting used in Excel.
Block
Generic term used to describe tables, crosstabs and charts containing data from the Data Provider in Business Objects.
Business Answer
An operational result that confirms a report’s accuracy in answering the business question.
Business Objects Report
A document produced by Business Objects that contains both data and formatting.
Business Question
The operational, defined question that guides the building of a query or report.
Case Universe
A view or construct of the ODS organized with respect to information found in and associated with the Case folder in CWS/CMS.
Cell
A rectangular formatting object found in or outside of a block. A Cell contains the value of a variable.
Chart
A visual representation of data from the report’s Data Provider.
Class
A collection of related objects contained in the same folder in a Business Objects universe.
Column
A vertical collection of cells, a column usually provides the values for a particular variable.
Condition
A definition designed to exclude undesirable values from a report, leaving only desired values, e.g., Case End Date Is null excludes closed cases.
Constant
An unchanging value against which a variable is compared, e.g., the constant “3” is used in the condition: Focus Age (Years) Greater than 3.
Count
The number of distinct occurrences in a set of values, e.g., a count of 1, 1,1,2,2,5 returns 3.
Count All
Count of all rows (values) in data, e.g., 1,1,1,2,2,5 returns 6.
Crosstab
A two-dimensional representation of data. Variables are displayed in columns, rows, and (usually a count) in the body.
Cube
Another term for the Data Provider where the data from a query is contained.
Custom Sort
Ordering data in sorts other than ascending (A-Z) and descending (Z-A).
Data Provider
A structure in which the retrieved data is stored in the Business Objects document. The embedded data in a Data Provider is displayed in charts, tables, and crosstabs. A report may have more than one Data Provider.
Data tab
The Data tab is used to manage the variables in your report. You can view this list in two different ways. In alphabetical order, all the variables in the document are listed in alphabetical order with the variables in the Variables folder and the formulas in the Formulas folder. By query, variables are grouped into the queries from which they were returned.
Detail
Provides additional information on an associated object. For example, the object Referral Received Date contains the details: Fed Quarter and State Quarter, among others, to assist in determining the number of referrals received during each of those periods.
Dimension
Key objects you are most likely to base your queries on as either Result Objects or in Conditions. Dimensions are typically character-type data (client names, 19-digit numbers, etc.), or dates (DOB’s, start dates, etc.).
Document
A Business Objects file with the extension “rep.” A document contains both data and formatting.
Drill
A method for exploring or displaying data in progressively greater detail. A very powerful function in Business Objects used for “data mining.”
Edit Data Provider
Also known as the Query Panel, where Result Objects and Conditions can be defined.
Extract Date
The day the data was copied from the production CWS/CMS database to the ODS. It is a useful object to include in a report as it shows readers how current the data is.
Filter
Reduces the amount of data displayed to specific values, e.g., a filter on Case Active Service Component may show only Permanent Placement cases.
Footer
The space at the bottom of the page below the report area used to identify your report and add page information to your report.
Formula
The definition of the contents of a cell, e.g., =
Function
Functions are used to create formulas and variables. They are predefined routines to return information in a different form. For example, you have a start date of 04/19/00; use the function Year (
Grid
A matrix of lines placed in the background to aid report layouts.
Header
The space at the top of the page above the report area used to identify your report and add page information to your report.
Map tab
The Map tab is used to manage the structure of your document. It has two views: a navigation view which displays a list of all the reports in the Business Objects document, or a structure view which displays a list of all the components in the selected report.
Measure
Numeric data that is the result of calculations performed on a dimension object in the database, e.g., Case Count is a measure of the number of cases in a given cube.
Null
The absence of data in an attribute, where no value is entered. This is different from an attribute that contains a zero, as a zero is a placeholder created by the system. For example, a case end date that has no value is said to be null (an open case).
Object
A unit that represents a variable in a database. Objects have been created to equal fields in the CWS/CMS database.
ODSxx Universe
A view or construct of the ODS organized using the CWS/CMS database physical names for entities and attributes. Classes are organized by entity (table) and contain the objects that match the attributes (columns) for that entity.
Operand
The object value to be searched for. In the condition Focus Age (Years) Equal to 18, the operand is 18.
Operands (Defined)
· You can create a condition that will compare the object with a Calculation. Some of the functions available include sum, min, max, average, and count.
· Create a subquery (All) and Create a subquery (ANY) allow you to create a query within a query; the subquery returns either all or any values, which are then used in the main query’s conditions.
· Business Objects can compare the values of two different objects using Select an object, such as “Case Plan Approval Date Less than or equal to COHP Start Date.”
· Show a list of prompts allows you to reuse an existing prompt. The user has to enter the value only once in order to complete more than one condition using the same prompt.
· Use Show a list of values to display values associated with the selected variable. Case Active Service Component will display Emergency Response, Family Maintenance, Family Reunification, and Permanent Placement. “Show a list of values” queries the database for values; Case Focus Child DOB will find all the birth dates in your county data.
· Type a new constant will allow entry of a specific value. For example, using “Focus Child Age (Years) Equal to,” you can enter a constant of ‘10’ to show children 10 years old.
· Type a new prompt gives you the ability to create a dialog box in which the user enters values for the conditions (dates, unit names, etc.). “Focus Age (years) Equal to Prompt (‘Enter age of child’)” will display a dialog with the title indicated in parentheses.
Operator
The specification of the relationship between the object and the operand. In the condition “Case Start Date Greater than 01/01/01” the operator is ‘Greater than’.
Operators (Defined)
· Between returns values between two operands. “Referral Received Date Between ‘01/01/00 12:00:00 AM’ and ‘06/30/00 12:00:00 AM’” will retrieve only referrals where the received date falls between the two constants (i.e. first half of 2000).
· Not between is the opposite of “Between,” e.g., “Referral Received Time Not between ‘08:00:00 AM’ and ‘05:00:00 PM’” will find referrals received after hours.
· Both is similar to a combined intersect query. The values returned will be equal to both values specified in the operand. For example, if the condition “Case Service Component Both ‘Emergency Response, Family Maintenance’” is employed, result objects will be returned for cases that have had both ER and FM as service components.
· Different from is the opposite of Equal to. It can be used to exclude variables (e.g., Case Intervention Reason Different from ‘Adoption Services’).
· Use Equal to when the desired object must be a certain value. “Equal to” can be used, for example, to indicate a preferred program (Case Active Service Component Equal to ‘Family Maintenance’), or a particular age (Focus Age (Years) Equal to ‘17’).
· Except is equivalent to a combined minus query. Except will return values that are different from the values specified in the operand, e.g., “Focus Gender Code Except ‘U’” will show focus children identified as either male or female, and not ‘unknowns.’
· Greater than, and Greater than or equal to can be used to establish the lower limit of a variable. For example, “Referral Duration Greater than or equal to ‘30’” will find referrals open thirty days or more.
· In list is the expanded form of “Equal to.” Use it when you want a variable that is included in a set of choices. “Placement Facility Type In list ‘Foster Family Home; FFA-Certified Home; Relative Home’” will find any of those Facility Types.
· The opposite of “In list” is Not in list. The variable is excluded from a list of results, e.g., “Placement Facility Not in list ‘County Shelter/Recv Home; Medical Facility.’
· Is null will return only objects that contain empty rows in the database. For example, “COHP End Date Is null” will only show the Result Objects for cases that have an open placement in the database.
· Is not null is the opposite of “Is null.” The object in the condition must have a value in it. “CP Effective Date Is not null” will show results only for cases with an approved case plan on file.
· Less than and Less than or equal to are used to create the upper limits of a variable. “Victim Age (Years) Less than or equal to ‘3’” can be used to find children with referral allegations who are three years of age and younger.
· Matches pattern will find variables that include the same character string. The condition “Focus Last Name Matches pattern ‘Smith%’ will return result objects such as Smith, Smithsonian, and Smithy. You can use the wildcards “%” (more than one unknown character) and “_” (a single character placeholder).
· You can also employ wildcards in Different from pattern. This operator is the antithesis of “Matches pattern,” excluding values that contain the specified character string.
Personal Data Files
Text, Excel, or Dbase files that can be imported into or exported from Business Objects. A Data Provider may be created from a Personal Data File rather than from a query in a Business Objects universe.
Pivot
A method for changing the axis of a displayed table, in which objects in rows are exchanged with objects in columns.
Predefined Conditions
Conditions built by the universe author; these are usually common conditions and included for convenience. For example, the Case universe contains a predefined condition “Open FM Cases Over 1 Year.” You can apply one or more predefined conditions when you build a query.
Prompt
A dialogue box defined by the report writer in a query’s conditions that requires an entry when the report is refreshed or run. Prompts are handy for reports that are run often, but with changing timeframes.
Purge
Empties data from the cube of a report; does not affect report formatting. Purge your data if you want to share a report with another county, but do not wish to include your county’s data in the report.
Query
A process by which data is retrieved from the database. A set of variables to be returned with associated conditions.
Query Panel
A window in Business Objects where report writers can specify the variables to be returned from a database, and the conditions applied to those variables. Also known as Edit Data Provider.
Referral Universe
A view or construct of the ODS organized with respect to information found in and associated with the Referral folder in CWS/CMS.
Refresh/Run
Updates the data in your report to the latest extract from the database. You can refresh all the data in your report or you can refresh individual cubes from the Data Manager.
Report
The focal point of your work with in Business Objects: where you view, analyze, and format data. A report is equal to a page tab in a Business Objects document, and there can be more than one in a document.
Report Manager
A key part of the Business Objects workspace that enables you to manage many different aspects of your work in Business Objects quickly and easily. It has two tabs: the Data tab is used to manage all the variables in your report, and the Map tab is used to work on the structure and formatting of report components.
Result Objects
The area of the Query Panel where objects are placed for the purposes of retrieving values.
Row
A record of a table. A row is created for each record added to the database, e.g., a new case on the case table.
Save And Close
An option available in the Query Panel, which allows the query to be saved without retrieving data. This is very helpful when creating large and/or multiple queries, and you need to save the Query Panel but do not want to wait for Business Objects to retrieve all records.
Scope Of Analysis
A subset of data returned by a query that you would use for analysis in your report. The data for your scope of analysis does not appear in the report until you use it in analysis.
The scope of analysis you can define depends on hierarchies in the universe. A hierarchy, which the designer sets up when creating the universe consists of dimension objects ranked from less detailed to more detailed. For example, the Service Component hierarchy in the Case universe consists of the following dimension objects: Case Active Service Component, Focus Primary Ethnicity, Focus Primary Language, Focus Gender Code, Focus Age (Years), Pri Staff Name Formatted, Case Name, & Case ID Number. You select dimension objects that belong to hierarchies to define the scope of analysis.
Slice and Dice
A user-friendly, graphical way of analyzing data. It displays the contents of the current report, and enables you to:
· Add, move and remove data.
· Switch between block types, e.g., turning tables into crosstabs.
· Build and edit master/detail reports.
· Apply, edit, and remove breaks, filters, sorts, ranking and calculations.
Snap to grid
Activates a grid for positioning blocks and/or master cells with precision. Snap to Grid is a toggle command, which either activates or deactivates the grid. When you activate the grid and move a block or master cell in the report, it is automatically aligned to the closest grid intersection.
Subquery
As part of a larger query, subqueries retrieve data with their own set of conditions, and then apply that data to the primary query in one of three ways. Subqueries can be union, intersection, or minus.
Table
A collection of associated information in a database stored in rows. Tables are also called entities in the CWS/CMS database.
Time encapsulation
A report-writing method by which data is retrieved only for variables during a given period of time. Using prompts in your conditions, as well as taking into account start and end dates, help you define a time encapsulation.
Universe
In Business Objects, a logical construct of classes and objects, and the links connecting them, that defines a view of CWS/CMS data.
Variable
A named formula. Business Objects includes predefined variables (objects) in its universes, or you may create your own variables.
Subscribe to:
Posts (Atom)


